
Data has a story to tell, one replete with nuances if one cares to listen and delve deep enough! If you own a website, you are probably privy to using Google Analytics to analyze every data point related to it. With GA4, the latest version of Google Analytics, one can amp up their analysis strategy with multiple notches. Here’s how GA4 is different from previous versions of Google Analytics;
• GA4 uses an event-based data collection model, which means you can track any interaction on your website or app, such as clicks, scrolls, downloads, video views, etc. One can also define their custom events and parameters to capture the data that matters to you. Previous versions of Google Analytics used a pageview-based model, which only tracked when a user visited a page or screen.
• GA4 has a unified interface for web and app analytics, meaning you can see and compare data from your website and app in one place. You can also use the User-ID feature to link users across devices and platforms and get a more complete view of their behavior and preferences. Previous versions of Google Analytics required separate web and app analytics properties and had limited cross-device capabilities.
• GA4 has more advanced features and integrations, such as machine learning, predictive analytics, BigQuery export, Firebase integration, Google Ads integration, etc. These features and integrations can help you gain deeper insights, optimize your marketing campaigns, and improve your user experience. Previous versions of Google Analytics had fewer features and integrations, and some required additional setup or cost.
• GA4 is more privacy-centric and future-proof, which means it respects user consent and data regulations, such as GDPR and CCPA. It also uses modeling techniques to fill in the gaps when data is incomplete or unavailable due to cookie restrictions or ad blockers. Previous versions of Google Analytics relied more on cookies and identifiers, which are becoming less reliable due to changing user preferences and browser policies.
To get the best out of the data on offer and create a solid base of crucial information about your business, one can create custom reports in GA4. We will shed light on using the free-form reports in the Exploration tool of GA4 in the sections to come.
Some of the benefits of using custom reports in GA4 are:
• Flexibility: You can create custom reports based on your own needs and goals and choose from different template types, data sources, dimensions, metrics, filters, and visualizations. You can also edit, duplicate, or delete your custom reports anytime.
• Customization: You can tailor your custom reports to match your brand identity and style and use various options to customize the appearance and layout of your report. You can also add annotations, segments, and drill-downs to enrich your report with more context and details.
• Insights: You can use custom reports to explore and analyze your data in-depth and discover new patterns, trends, and opportunities. You can also compare different segments, periods, or dimensions and identify factors influencing your performance and conversions.
Now., let’s get into the details of creating a custom report.
Step 1: Create a custom report template
To begin creating your custom report, log in to your Google Analytics 4 account and select Explore on the left navigation bar.
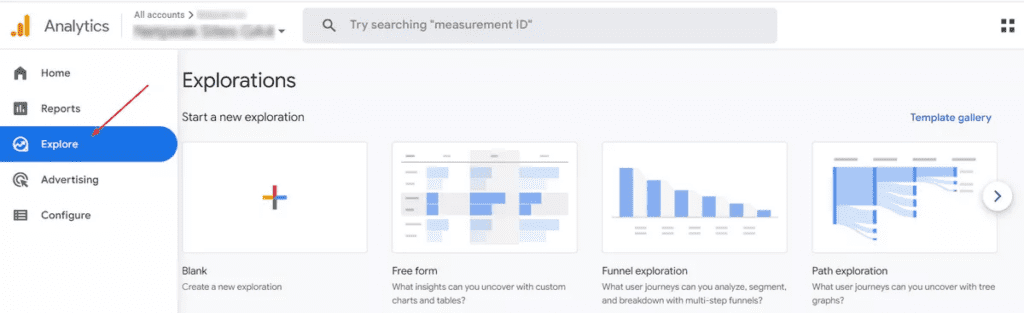
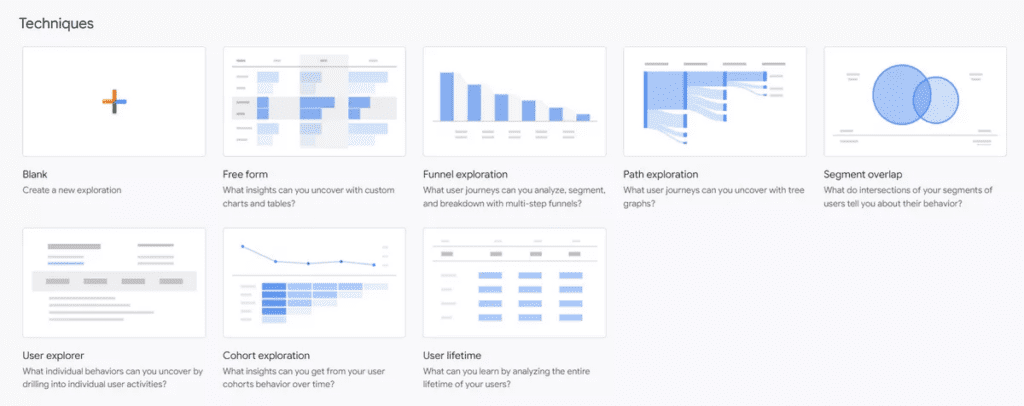
There are multiple report templates to choose from; we will go with the Free Form option as it offers greater flexibility and ease of combining various parameters.
Step 2: Configure the report settings
You can render a name to the exploration by changing the Exploration name in the top left part of the interface.
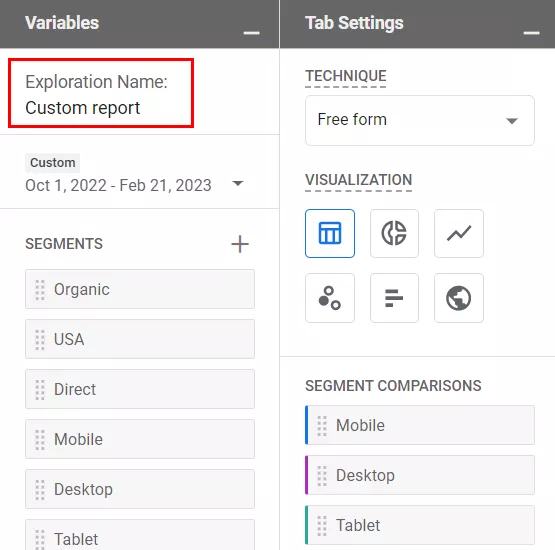
One can also set the date range for the report.
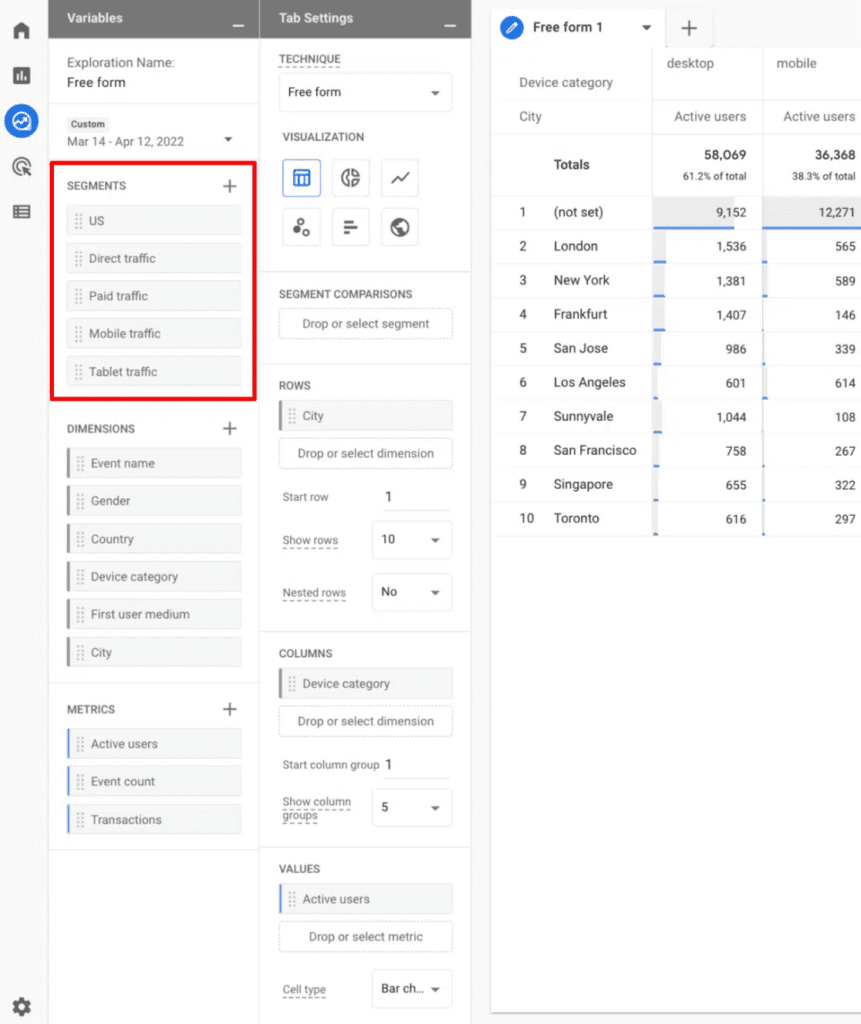
You can also proceed to set certain filters or segments to enhance ease of comparison. For instance, you could set the filters for mobile or desktop traffic, converting users, traffic from multiple channels (paid, social or organic), etc.
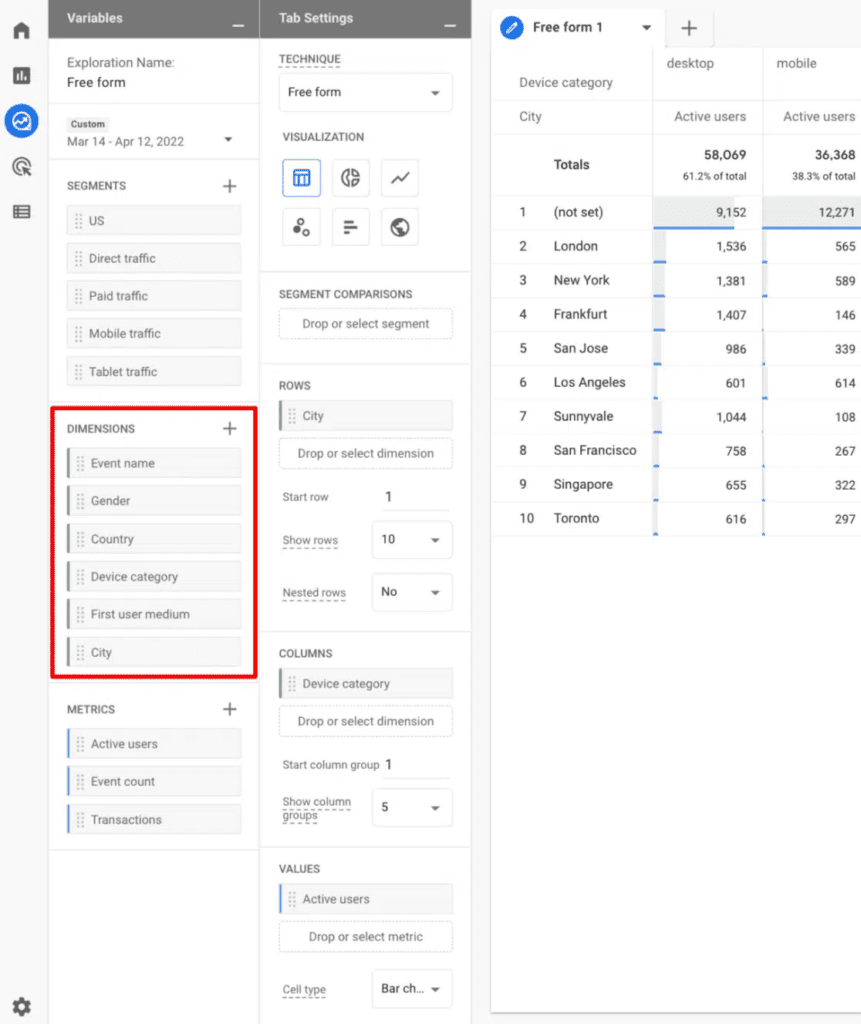
Step 3: Add dimensions and metrics
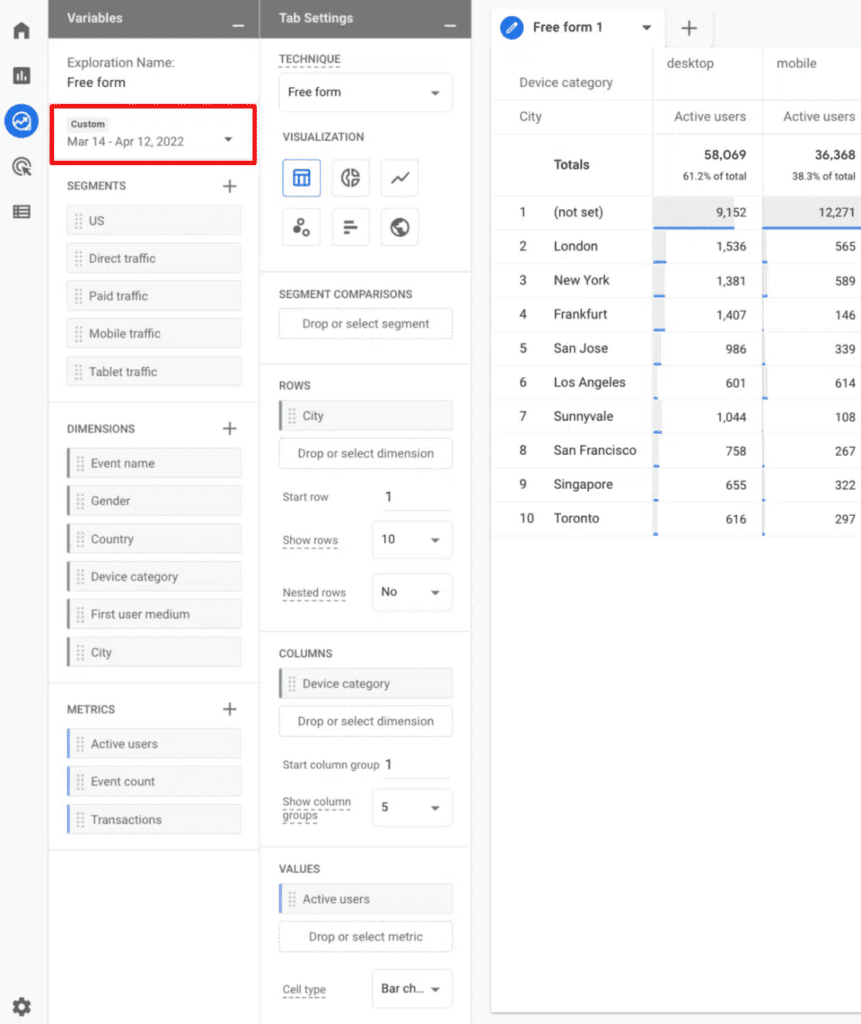
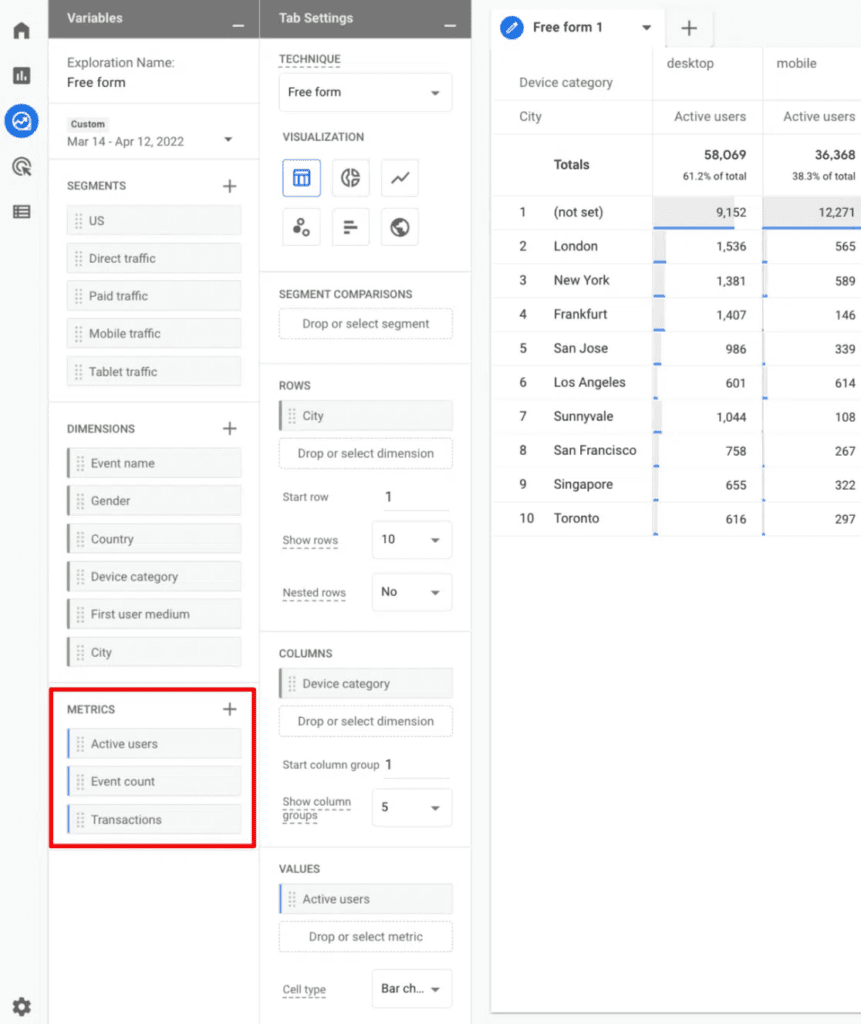
You can choose what data you want to see in your report, such as user behavior, conversions, revenue, etc. Dimensions are the attributes of your data, such as country, device, page, etc. Metrics are the quantitative measurements of your data, such as sessions, users, bounce rate, etc.
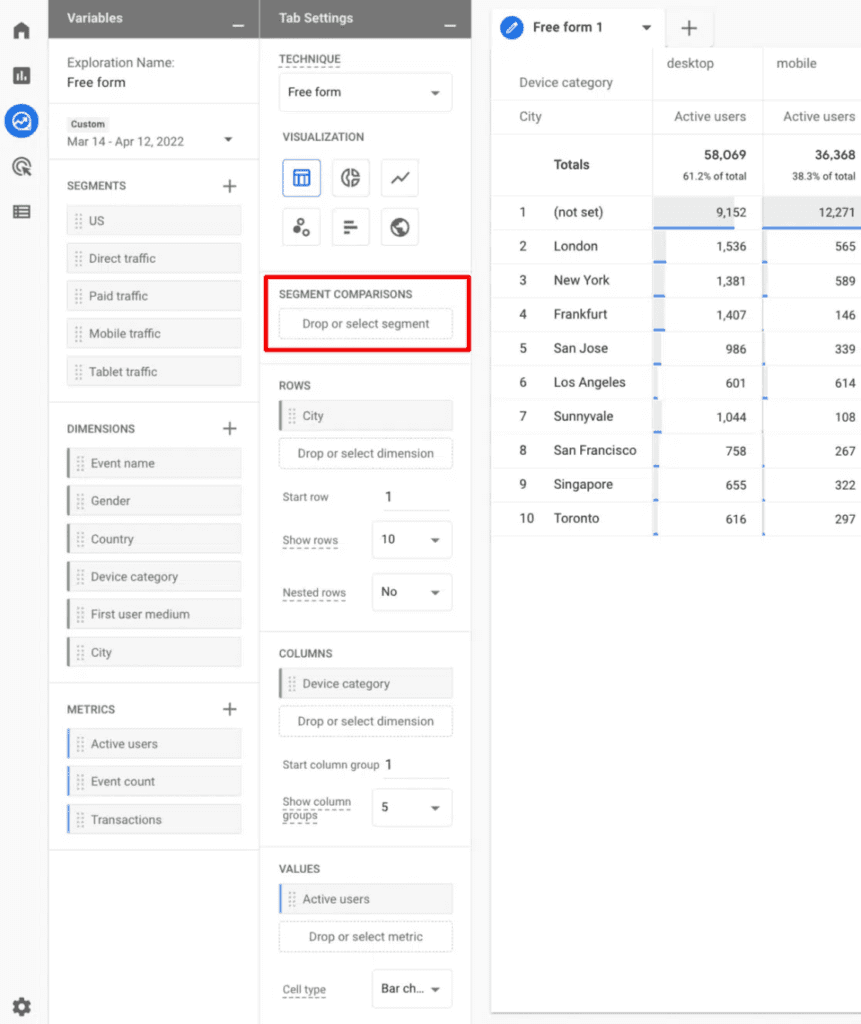
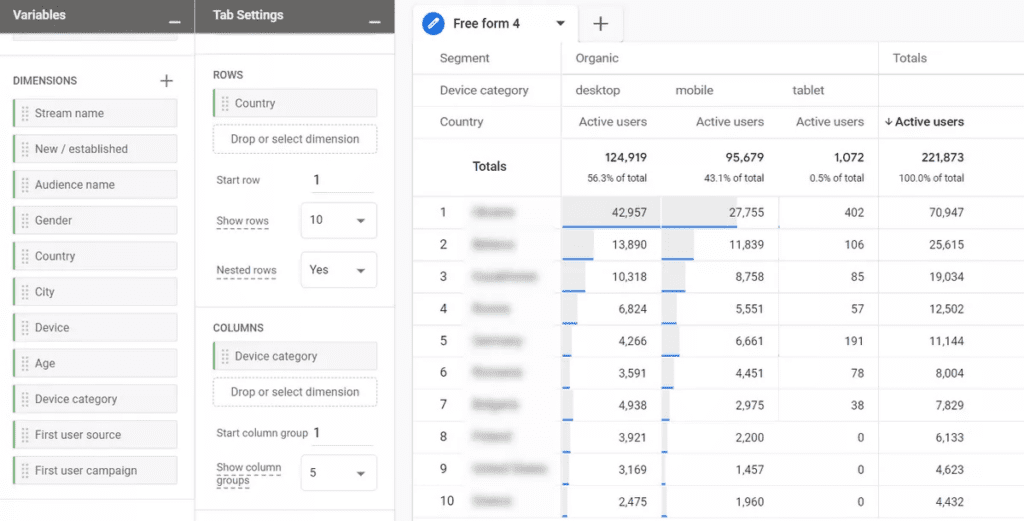
One can then proceed to Drag and Drop up to four segments (already included in the Segments section of the Variables tab) in the Segments Comparison Box.
One can then add the dimensions to be displayed in the rows and columns of the table.
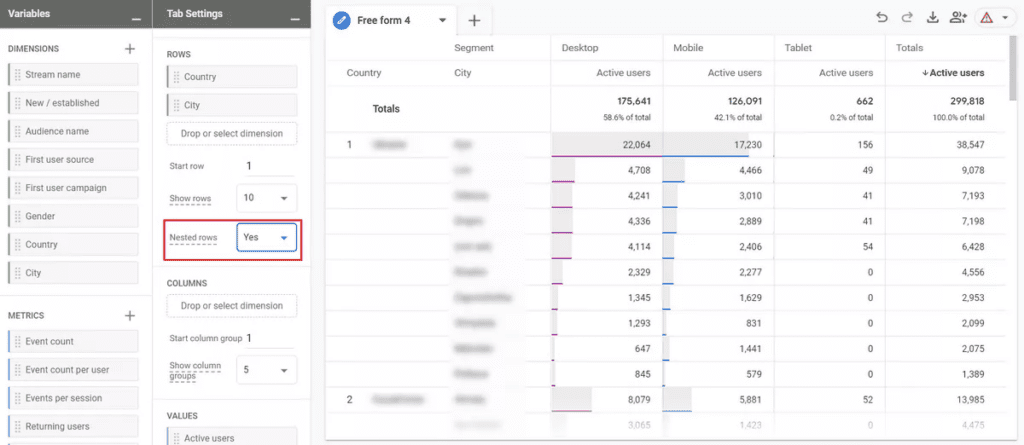
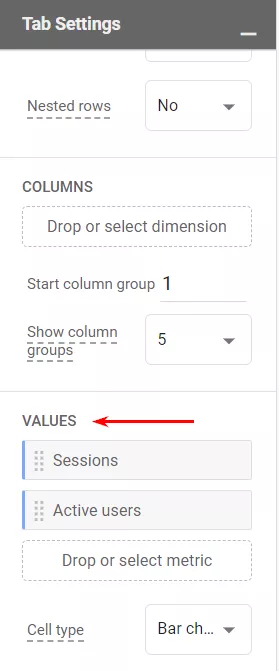
One can also add a maximum of ten metrics in the Values section.
Step 4: Visualize and analyze the data
Once you are done with adding all the requisite settings in the Tab Settings & Variables columns, the report can be downloaded.

You can use different visualization options to display your data clearly and engagingly, such as tables, charts, maps, etc. You can export your data to other formats or platforms if you want to share or further analyze it.
Conclusion
Now that we are equipped with the know-how to create custom reports on GA 4, all those elusive data points will now be at your fingertips for perusal and detailed analysis. However, if you’d rather let experts look into the GA consulting for your business, then team awesome @Mavlers is always happy to pitch in with the best and most detailed insights your business needs to elevate itself to the next level!