If you’ve worked with Marketing Cloud Engagement (ExactTarget), you’re probably familiar with Contact Builder and Data Designer, the tools used to link Data Extensions and structure customer data. In Marketing Cloud Next (Growth & Advanced Edition), that concept has evolved into something far more powerful: the Data Graph.
As you may already know, real-time personalization is table stakes for marketers now. Done well, personalization can drive up to 40% higher revenue compared to those who fall short.
In Salesforce, a clear understanding of Data Graphs is integral to your personalization efforts.
What is a data graph?
In Salesforce, a Data Graph is a visualization and architectural tool. It’s a map of your data that connects various objects together into a single, unified view. Instead of querying multiple tables and trying to link them on the fly, a Data Graph gathers all relevant information about a customer (or any entity) and stores it in a structured format that you can use immediately.
A data graph uses a hub-and-spoke model that gives you a unified, relational view of your data.
The hub: Unified Individual
At the center is the Unified Individual, also called the Golden Record. This profile consolidates customer identities across systems. For example:
- “Sarah Smith the shopper”
- “Sarah.Smith@email.com the subscriber”
Both are recognized as the same person and merged into a single unified profile.
The spokes: Data Model Objects (DMOs)
Connected to the Unified Individual are Data Model Objects (DMOs). These represent different aspects of customer data, such as:
- Contact details (email, phone)
- Transaction history
- Loyalty program data
- Engagement activity
- Associated accounts or organizations
This structure allows you to easily navigate and use related data without complex joins.
As far as Marketing Cloud Next data model objects go, be deliberate about which DMOs you include. Every additional DMO and level of nesting increases the transform cost. Start lean, and only add what your use case genuinely requires. You can also use Data Cloud Transforms to pre-filter data before it enters the Data Graph which can reduce costs dramatically.
Let’s find out how to create a data graph in Marketing Cloud Next.
Creating a data graph
Follow these steps for creating a data graph in Marketing Cloud Next:
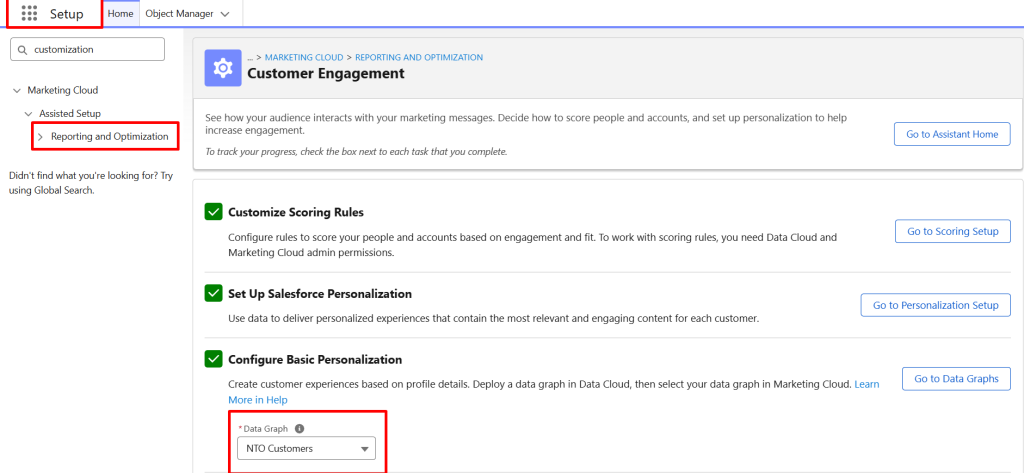
- Navigate to Assistant Home in Setup and open the Customer Engagement tab.
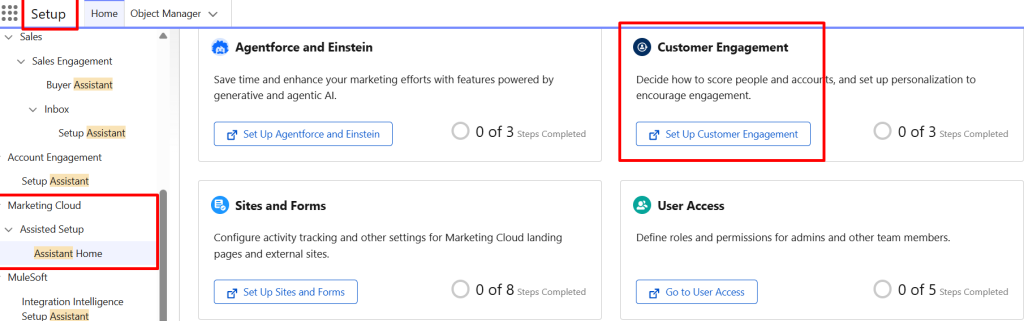
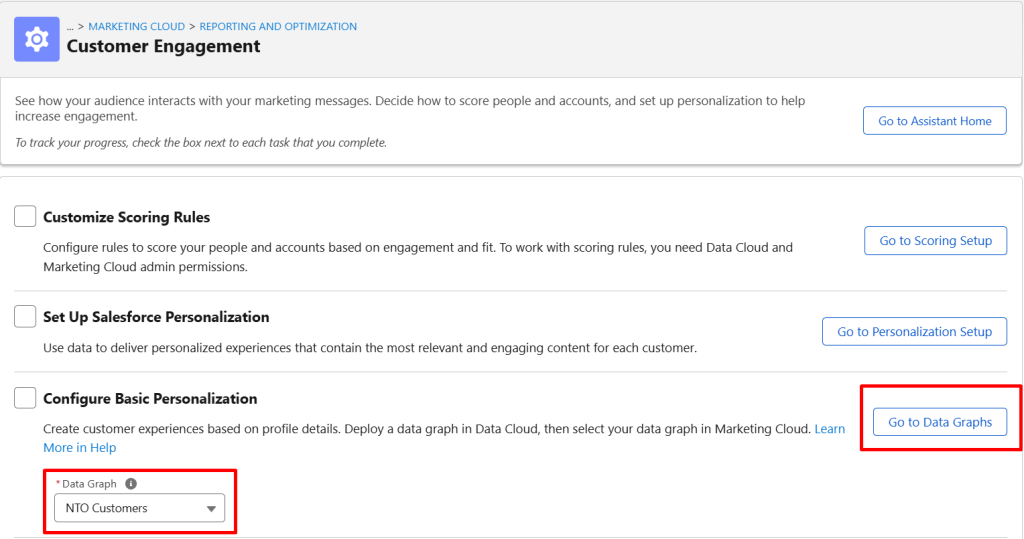
- Under Configure Basic Personalization, you’ll see the currently selected Data Graph. To create a custom one, select Go to Data Graphs, as shown in this screenshot.
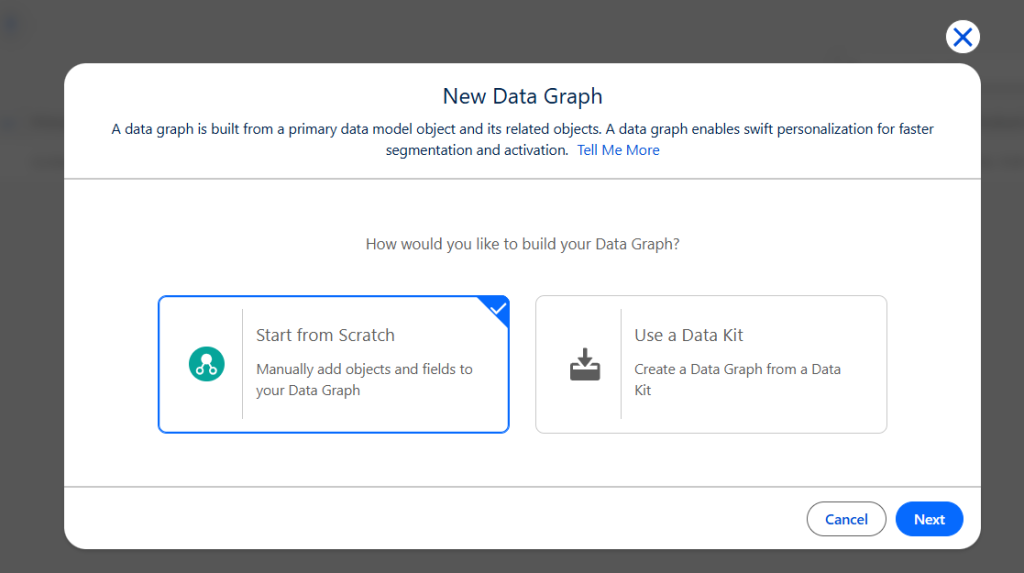
- Next, click New, then select Start from Scratch and click Next.
- Leave the Standard Data Graph tile selected and click Next.
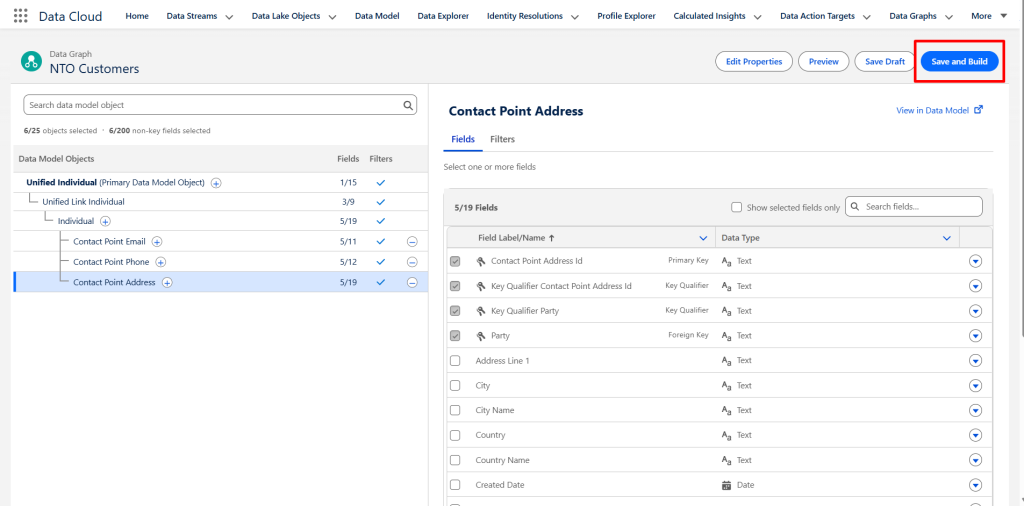
- Enter a name (NTO Customers, in this case) in the Data Graph Name field.
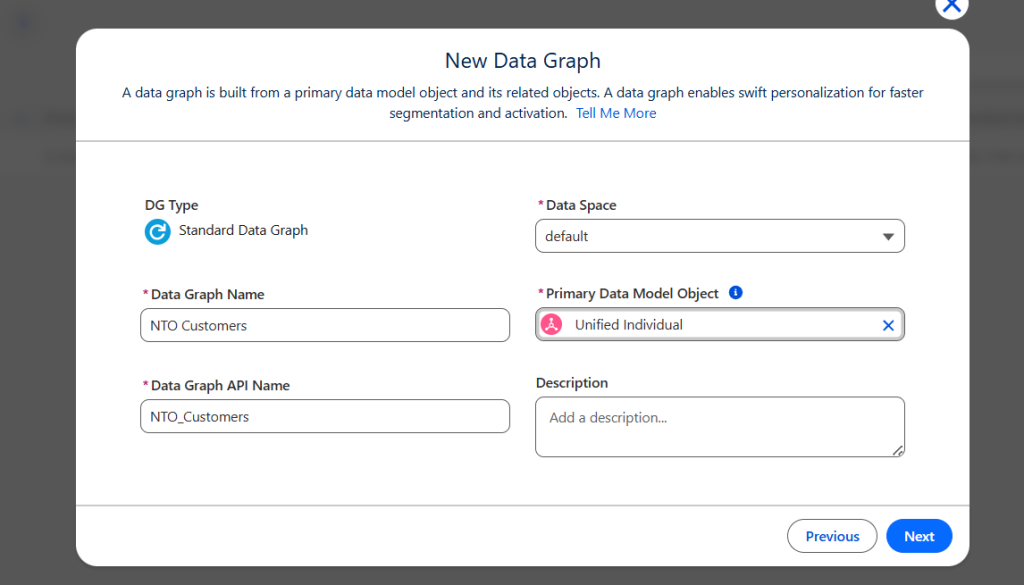
- Select Unified Individual as the Primary Data Model Object and click Next, as shown in this Marketing Cloud screenshot.
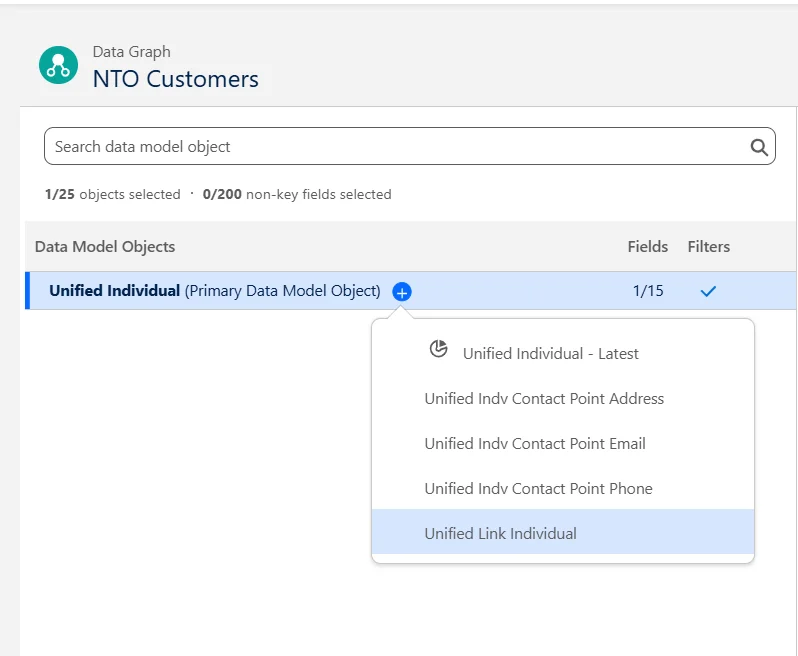
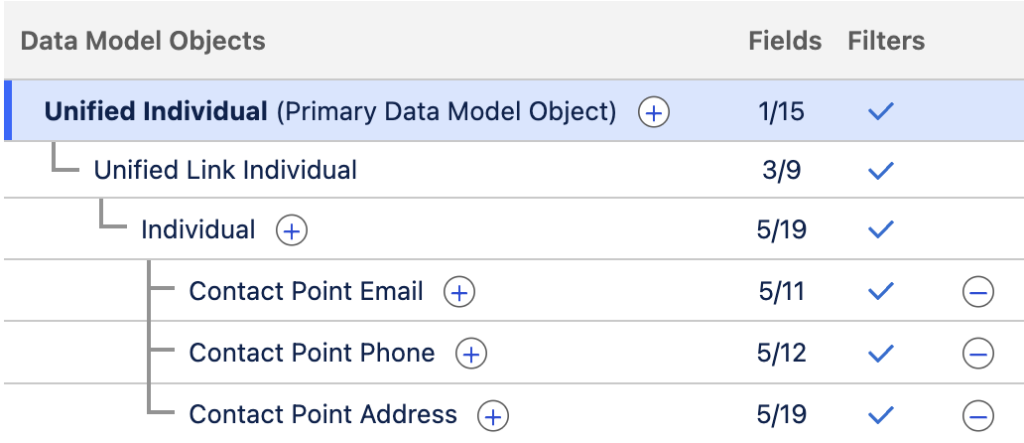
- In the Data Model Objects tree, click the icon next to Unified Individual and select Unified Link Individual, then Individual.
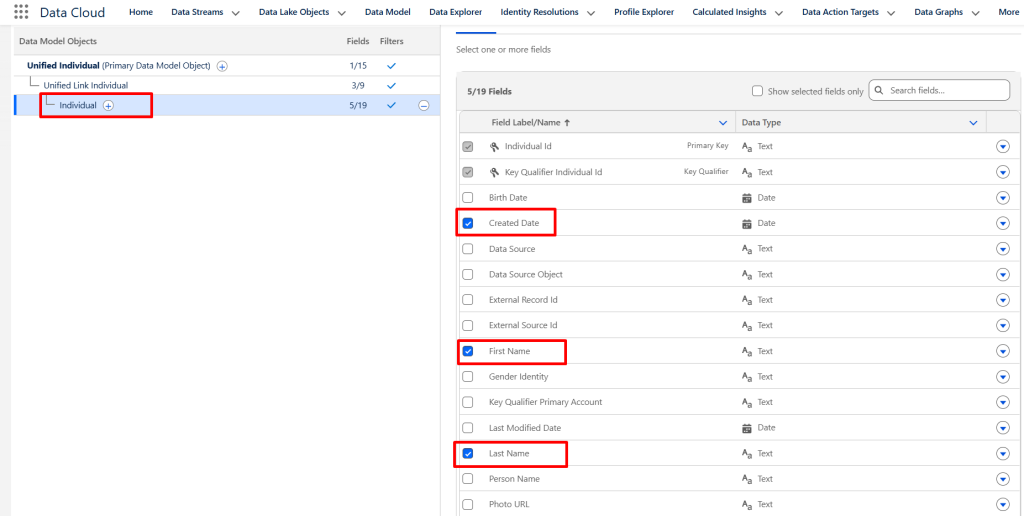
- From the Fields list, select Created Date, First Name, and Last Name.
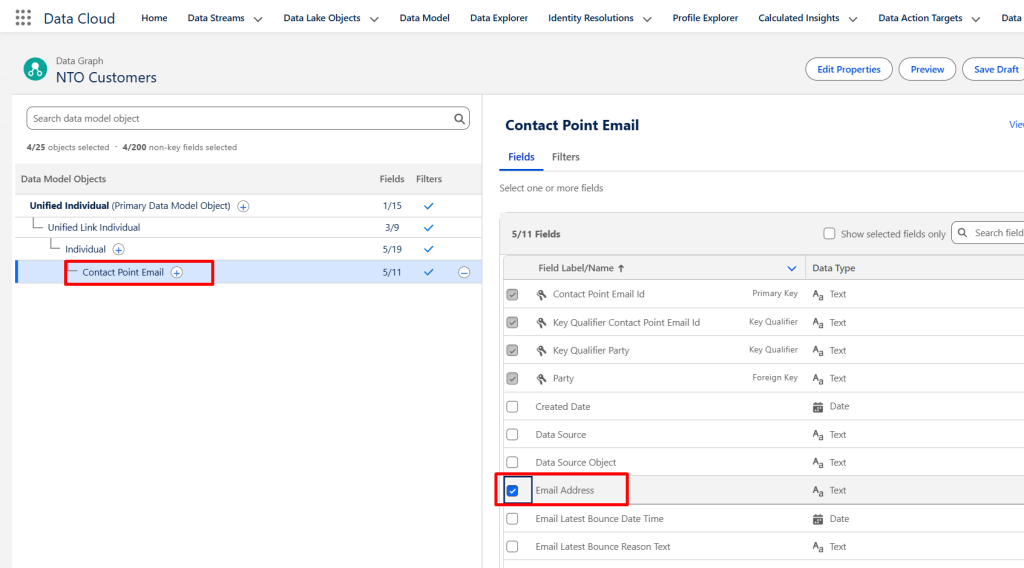
- Click the icon next to Individual, then select Contact Point Email and choose Email Address from the fields list.
- Select Contact Point Phone and choose Telephone Number from the fields list.
- Verify the structure and field count, then click Save and Build.
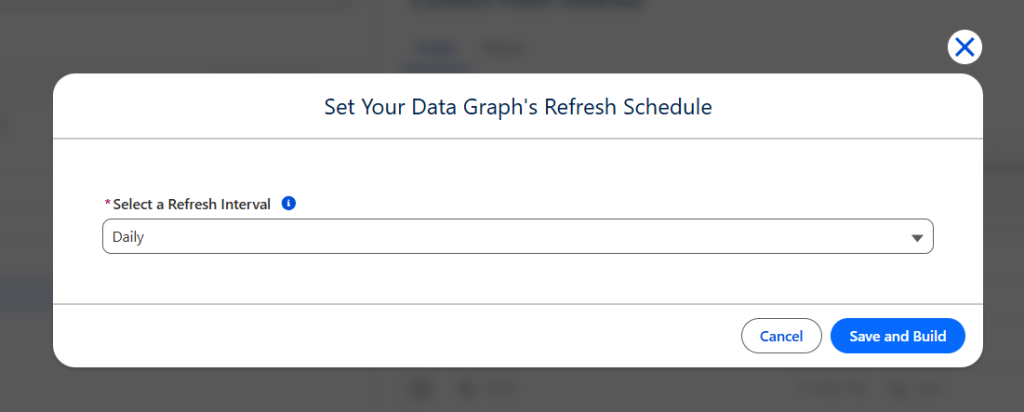
- In the Refresh Schedule modal, select Daily as the refresh interval and click Save and Build.
So much for the setup. Now let’s consider a very basic personalization use case.
How to use a data graph in Marketing Cloud Next?
Once built, the Data Graph becomes available as a data source when creating content. A simple example is using it to personalize an email template with merge fields. The steps:
- Select the Data Graph (such as Unified Individual) as the primary data source.
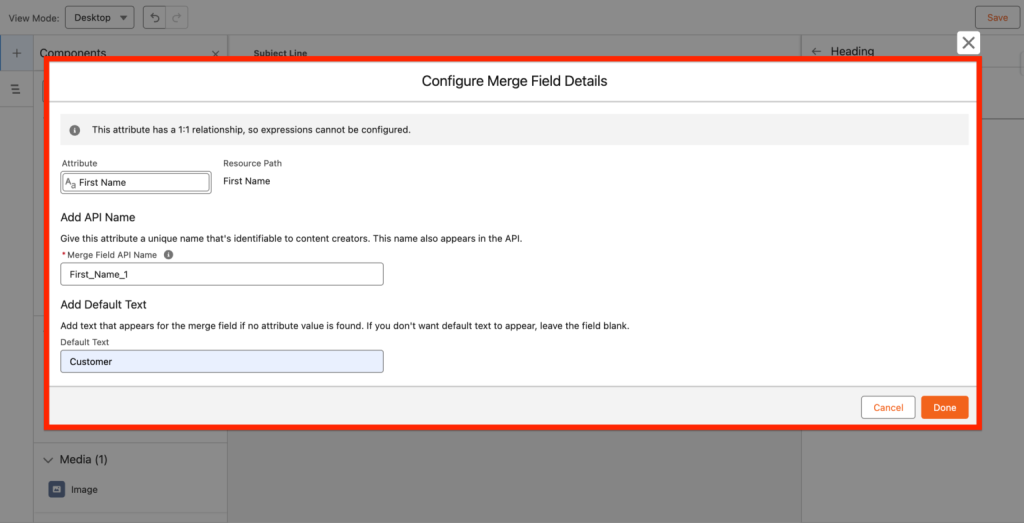
- Within the Heading widget, select the button Add a Merge Field.
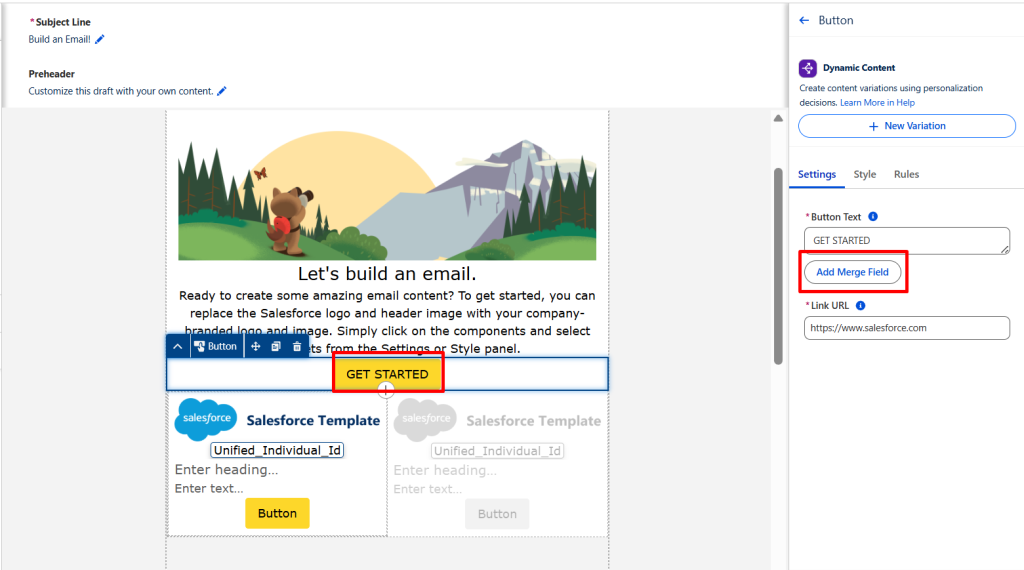
- Click Select Data Graph Attribute.
- Navigate through the structured object tree to find the required attribute; for example, First Name under Individual.
- When inserting the merge field, you can define the default text. This ensures that if the attribute value is missing, a fallback such as “Customer” is displayed instead.
With the Data Graph in place, you now have the foundation to build smarter, more connected, and highly personalized experiences in Marketing Cloud Next.
Configuring the default data graph
After building your Data Graph, you need to define it as the system default. Here are the steps:
- Go to Marketing Cloud Setup → Reports and Optimization → Customer Engagement → Configure Basic Personalization.
- Select the Data Graph you created earlier and set it as the default.
- Once configured, the Data Graph will automatically load whenever you open the email editor.
This ensures consistency across campaigns and removes the need to manually select a data source each time you create content. It streamlines the personalization process and reduces configuration errors.

Getting started with data graphs
At first glance, data graphs may seem complex.
However, if you have experience with Contact Builder in Salesforce Marketing Cloud, you can think of it as a more advanced and scalable version of Data Designer.
With the Data Graph:
- Data is unified
- Relationships are clearer
- Personalization becomes easier and more powerful
It provides the foundation to deliver smarter, connected, and highly personalized customer experiences at scale.