Ladies & gentlemen, allow me to set the scene…
It’s 5:07 PM on a Thursday. The dashboards are blinking, the Slack channels are tranquil (either a good sign or a terrible one), and you finally pour yourself a generous glass of something red, dry, and definitely earned.
Across the table sits a fellow digital marketer.
Now this chap is sharp, curious, and slightly haunted by last week’s broken tracking template, and not-so-out-of-the-blue he quips:
“Okay, quick question. Can you tell me which CM360 reports you actually use every day?”
You smile because you know where this could be going.
Well, CM360 is a powerful tool, but only once you stop relying on the templated reports and begin building your own custom ones. That’s where the real data-driven advantage kicks in.
So you take a sip, lean in, and start sharing the 5 CM360 custom reports every performance marketer should swear by, the ones that make debugging cleaner, decisions faster, and results, well, actually better.
1. The cross-channel reality check (a.k.a. the “Are we actually doing well?” report)
Let’s take a moment and acknowledge this one fact, honestly. Campaigns haven’t lived in single channels since 2014.
You’re trafficking display in CM360, reporting on DV360, tracking YouTube via wrapped URLs, stitching SA360 in for good measure, and somewhere, an affiliate manager is still sending you Excel sheets named FINAL_v27_REALLYFINAL.xlsx.
Simply put, a cross-channel performance report is the one place where all these worlds finally sit down for coffee together.
Let’s delve into what it tells you (that nothing else quite can).
You get a hang of the channels that are actually driving conversions and not just clicks.
You get to know where your ROAS quietly spikes or nosedives, whether view-through assists are pulling more weight than you thought and which creative IDs and placement types punch above their weight.
Want to know a pro marketer move?
We recommend adding a custom dimension for Channel Type, because nothing screams “control” like seeing Display, Video, Native, and Affiliate performance side-by-side in one clean, smugly satisfying table.
It’s the closest thing CM360 has to an all-hands meeting that actually gets things done.
2. The path to conversion report (for understanding how people actually behave)
Now, we all know that nobody converts after one impression (nope, we are not talking about those impulse purchases, we end up regretting later!)
The truth is that users meander. They window-shop, get distracted by a cat video. Then they see your ad again and finally decide to convert.
The path-to-conversion report is where that entire story lives, messy, beautiful, nonlinear.
Wondering why every serious marketer needs this?
Well, because it reveals which channels and touchpoints drive conversions before the conversion that gets all the glory.
Those undervalued upper-funnel workhorses? They finally get their flowers here.
Here is an insight into my go-to metrics:
~ Number of interactions before conversion
~ Time lag to conversion
~ Conversion type (Click vs View-through)
~ Assisted conversions
~ Conversion rate by path length
On that note, we recommend switching between attribution models, Last Click, Linear, Position-Based, and Time Decay, and watch how your “winning channel” suddenly changes personalities like a Gemini in Q4.
If you’ve ever suspected your upper funnel is being robbed of credit, this is where the truth lives.
3. Placement performance report
Some placements are gold while others are a lesson.
And CM360, bless its structured reporting heart, gives you a way to separate the two. The Placement Performance Report is your flashlight in the dense jungle of inventory.
Here’s what makes it priceless, you finally get to see which sites deliver real conversions and which placements look great in CTR but terrible in CPA.
You also come to know where viewability drops faster and thinner than your patience on a Monday, and what’s genuinely premium vs. what’s pretending to be.
Speaking of which, here are the metrics you don’t skip:
~ Site Name and Placement ID
~ Impressions, Clicks, CTR
~ Conversions and Conversion Rate
~ eCPM, eCPC, and CPA
~ Viewability Rate (Active View)
It’s good to filter placements by CPA or ROAS, highlight the winners, and yes, ruthlessly bench the ones burning holes in your budget.
Pair that with suspicious activity indicators, and you suddenly look like the marketer who can smell inefficiency before it shows up in pacing.
4. Creative performance report
So every marketer has lived this moment, where you are armed with the perfect targeting, the pacing is immaculate, and the frequency is well-behaved, but the performance fizzles out as a flat day-old soda.
The hidden culprit could be the creative!
This is why the Creative Performance Report is gospel, as it cuts through opinions and politely tells the creative team, “Hey, that quirky GIF you love, well, sorry to break it to you, the audience doesn’t.”
Here’s what it uncovers:
The formats that actually drive engagement
The images that get ignored (even if they “felt cute”)
Which videos get completed and which get abandoned at 3 seconds
Which creatives convert vs. merely attract window shoppers
Let’s now take a look at the metrics you should always include:
~ Creative name & format
~ Impressions, clicks, CTR
~ Interaction rate
~ Video completion rate
~ Post-view conversions
~ Cost per conversion
Need a solid tip?
Well, you can add a custom column for Cost per Engaged View or Conversions per Creative Format.
It’s the difference between “We think this creative is working” and “Here is proof this creative is paying our salaries.”
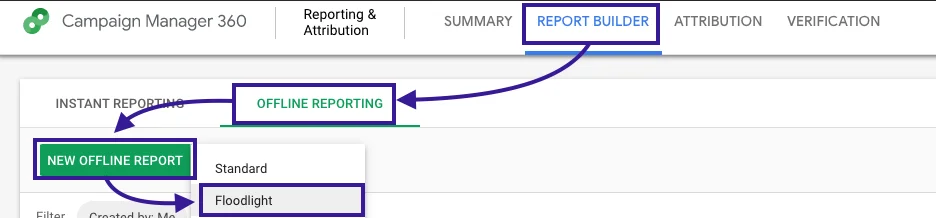
5. The floodlight activity report
Interestingly, floodlight tags are the quiet infrastructure silently tracking every add-to-cart, every lead, every purchase.
If your Floodlights break, your entire measurement universe collapses like a Jenga tower kicked by a toddler.
The floodlight activity report is where you monitor the health and behavior of your entire conversion ecosystem.
It keeps you in the loop about which actions users are completing, which tags fire most and which are suspiciously quiet.
They also tell you about revenue generated per conversion, device-level breakdowns and how attribution models change the perceived value of each action
A smooth move can be to group floodlight activities by funnel stage; begin with awareness, move onto consideration and then finally purchase.
Suddenly you see where you’re strong, where you’re weak, and where people quietly drop into the void.
This is how you stop guessing and start optimizing.
The road ahead
On that note, you might want to read this next ~ How To Use GA4 & Search Console Data For SEO Measurement And Better Rankings.